COLORS OF THE MOON
(move your mouse over this image)
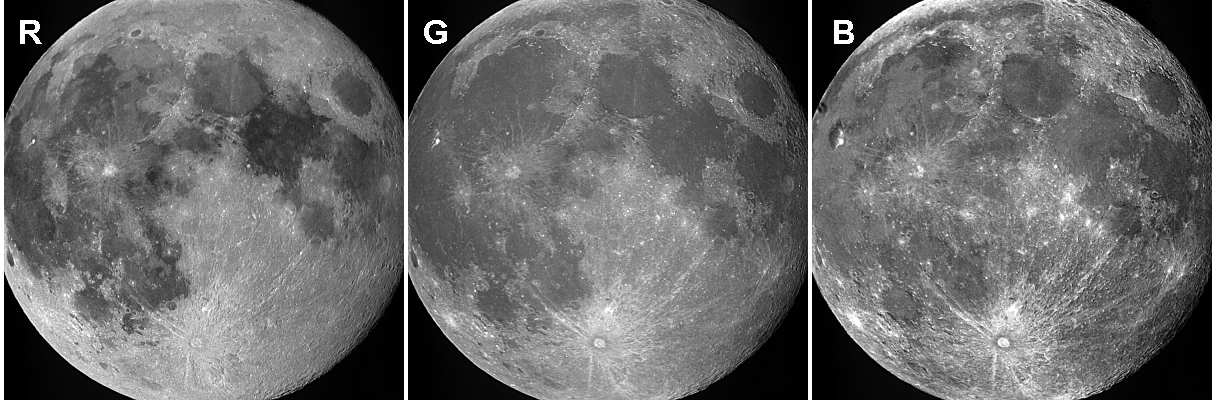
(click on the image for an RGB-decomposition)
 |
|
Even a full color image of our moon looks like a normal black-and-white photograph. However, there are subtle color differences
present that are just too weak to be noticed. By enhancing these color differences another face of the moon appears and
shows us differences of chemical composition of the surface. (move your mouse over the image to view this enhanced color image). Note for instance the blue tint of Mare Tranquillitatis, the white lines of debris radiating from Tycho and other white features around smaller craters and the brown structures in Mare Ibrium, Mare Serenitatis and crater Plato. The crater Copernicus shows a distinct difference in composition of its western wall. To produce this color enhanced image the following procedure was followed: The mean intensity level of the R-, G- and B-images were made equal to each other, resulting in a neutral grey color image (except for the weak color differences). After this, the deviation of the color values r,g and b of each pixel from the mean value (r+g+b)/3 is enhanced by a certain factor (in this case 15 times). Thus, as an example for r: factor:=15; mean:=(r+g+b)/3; r := factor*(r-mean)+mean; (Click on the image to view of the individual enhanced R, G en B-images) |