For measuring and checking the transmission curves of my SII, H-alpha, OIII and RGB optical filters I constructed a simple but effective spectrometer using a replicated transmission grating. The figure below gives a schematic drawing of the spectrometer (scroll down for a photograph of the actual setup). The spectrometer comprises two arms under an adjustable angle  . The first holds a small white source to illuminate the grating that creates a spectrum. The second captures this spectrum and focuses it onto an image sensor. The filter to be examined is placed in the light path and only transmits part of the spectrum for which it is designed. The ratio of the spectrum with and without the filter results in the transmission curve of the filter. . The first holds a small white source to illuminate the grating that creates a spectrum. The second captures this spectrum and focuses it onto an image sensor. The filter to be examined is placed in the light path and only transmits part of the spectrum for which it is designed. The ratio of the spectrum with and without the filter results in the transmission curve of the filter. |
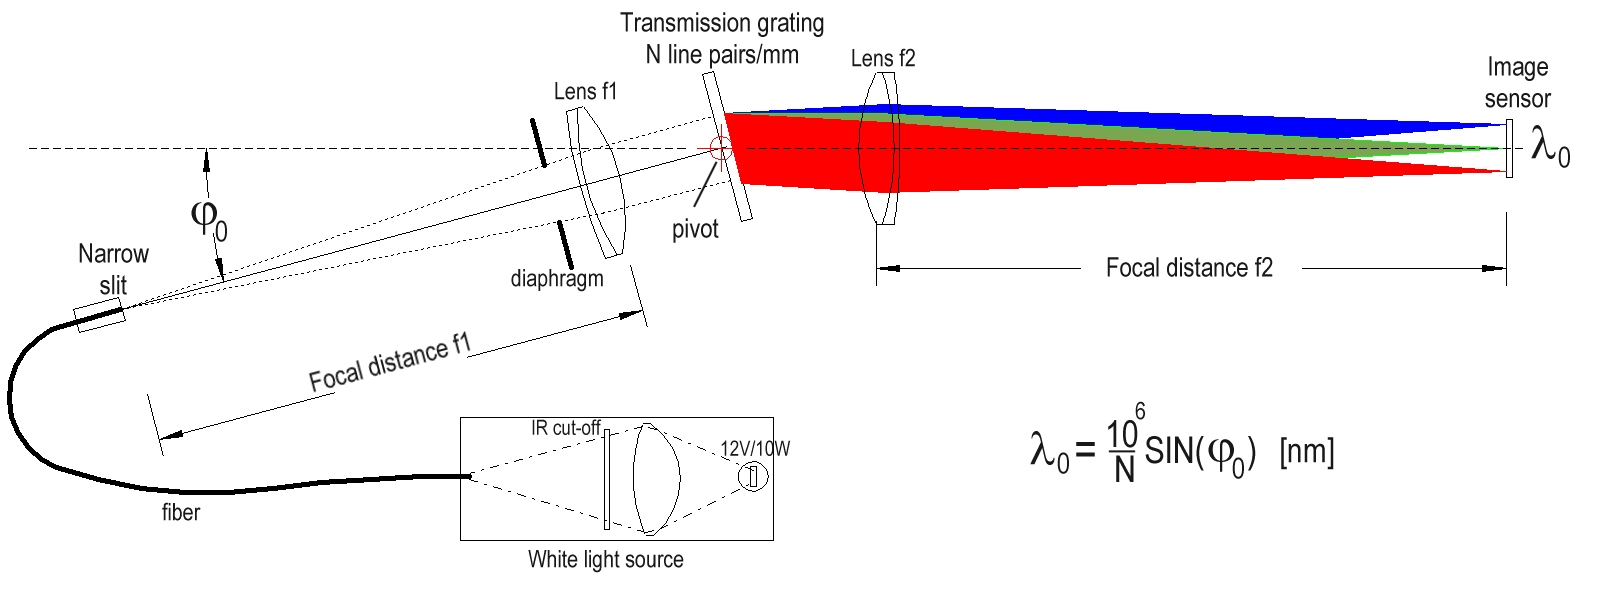 |
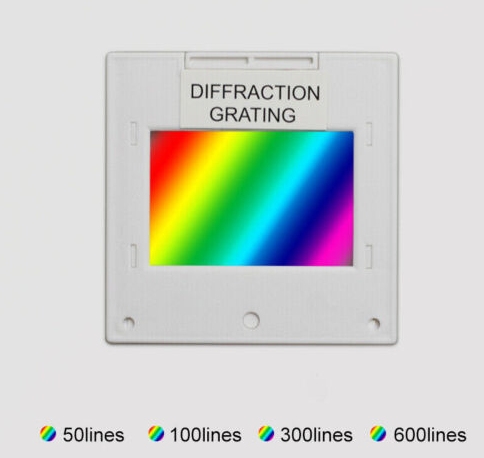
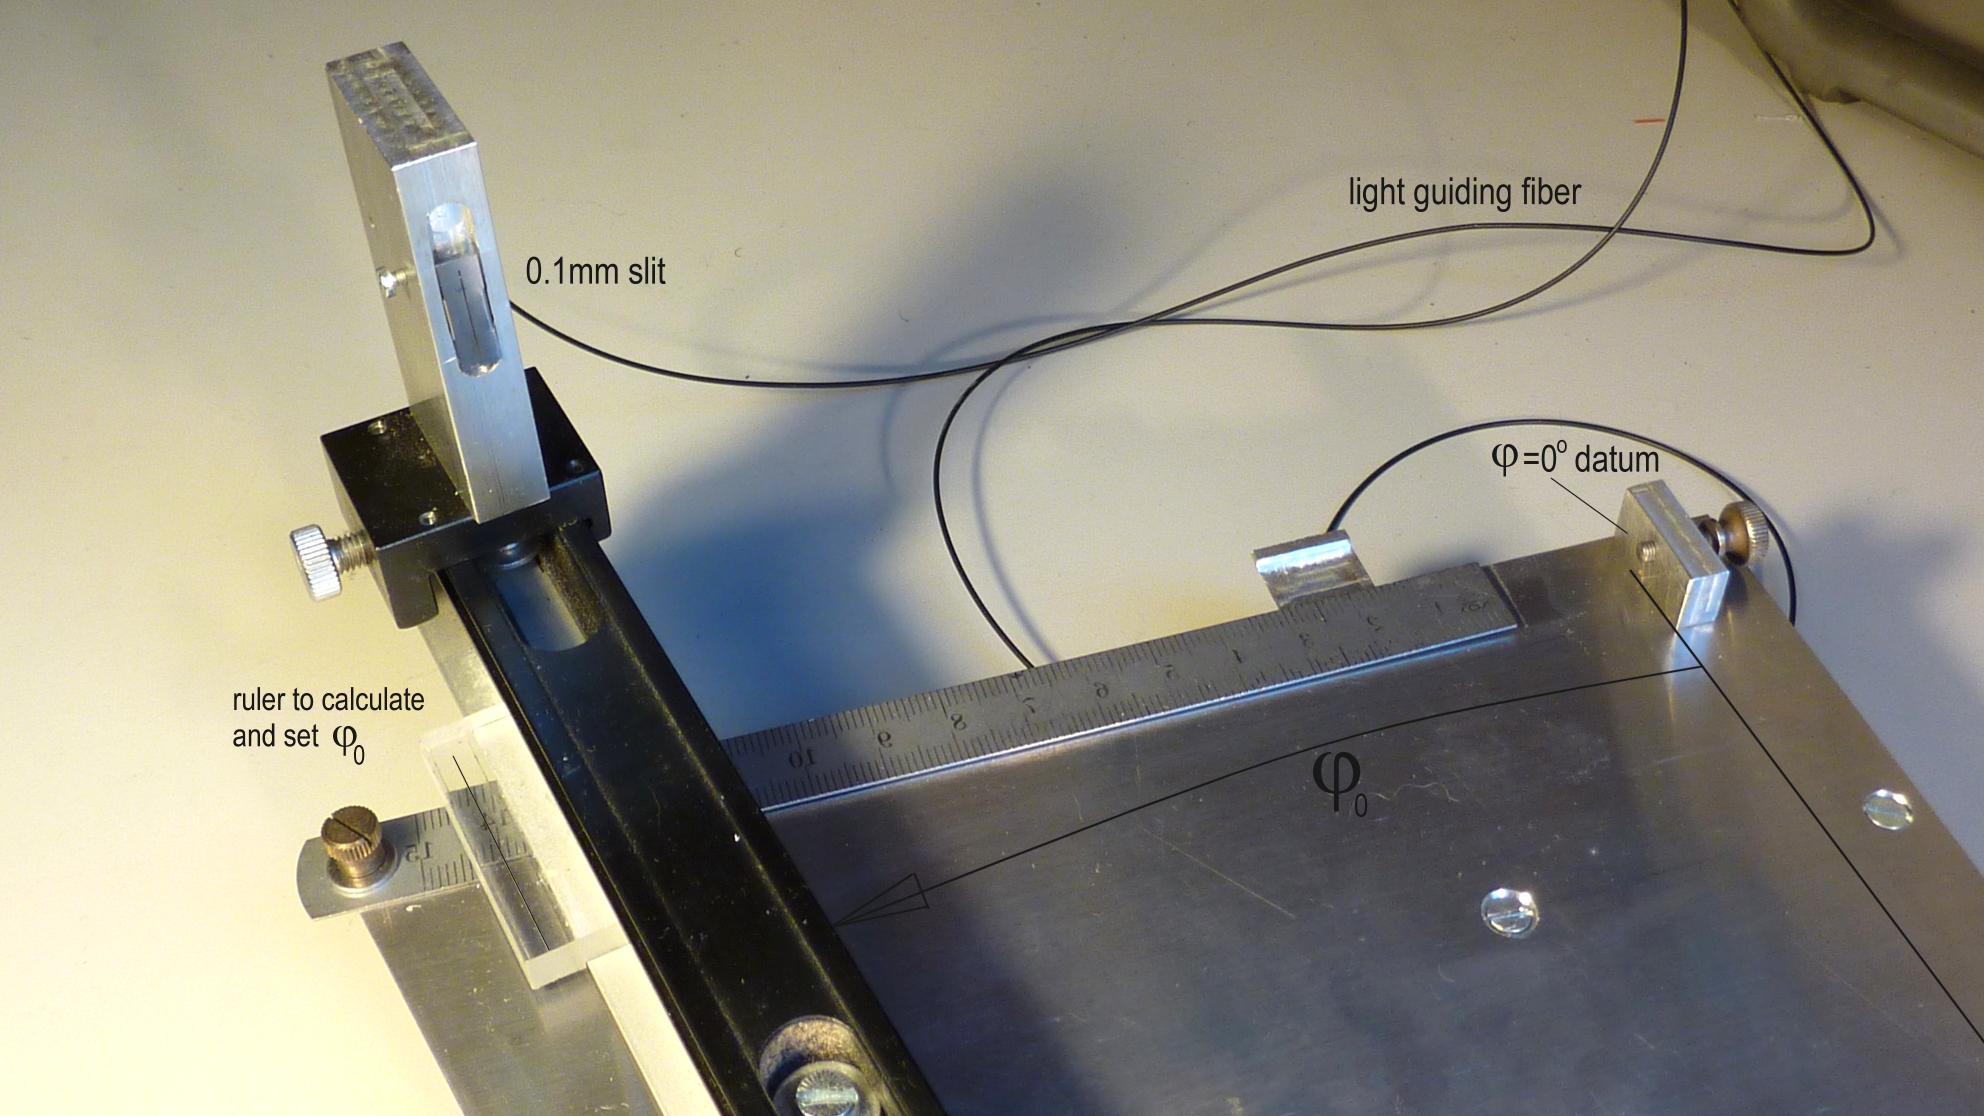
For the interested: Some more details, formula and numbers: The light source is a 10W Tungsten-Halogen lamp focused, using an aspherical condensor lens, on a 0.25mm core plastic fiber that guides the light to a 0.1mm wide slit. To avoid melting the plastic fiber, the white light source contains an IR-cut-off filter (>750nm). White light exiting the slit is collimated (i.e. made parallel) using an f1=500mm achromatic lens. An iris diaphragm limits the diameter of the collimated beam to 10-15mm diameter to ensure that it is passed unobstructed from source to detector. The beam hits the grating orthogonally (i.e. along the normal to the surface of the grating). The beam is diffracted by the transmission grating, splitting it in a continuous spectrum of collimated beams with the following relation between wavelength  (in nm) and diffraction angle (in nm) and diffraction angle  : :  . .Where N is the number of line pairs per millimeter of the grating. I use N=100 or N=300 lp/mm gratings. The first arm can pivot around the center of the diffraction grating in order to set the central wavelength  by setting . by setting .
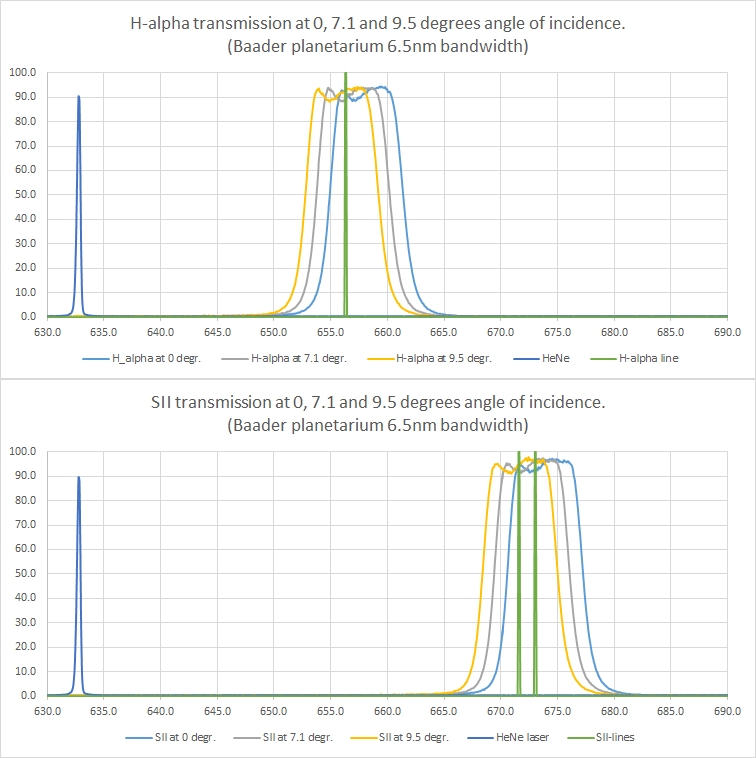
The second arm also contains an achromatic lens (f2=500mm). It focuses the beam with the selected on the center of the image sensor. I use my FTT1010M CCD-camera for this purpose. It is 1024 pixels wide with a pixel size P of 0.012mm.With focal length f2 large compared to the pixel size P the following approximation for the wavelength change per pixel holds:  . .With P=0.012 and f2=500 it follows that  =0.24 [nm/pixel] for N=100 and 0.08 [nm/pixel] for N=300. =0.24 [nm/pixel] for N=100 and 0.08 [nm/pixel] for N=300.For my 1024 pixels wide sensor the wavelength range of the spectrum with N=100, is 1024* =246nm. Selecting =580nm at the center position of the image sensor results in covering the 460-700nm range. This requires setting the angle to 3.33ş.With N=300 the range reduces to 82nm. Different settings are needed to measure at the OIII wavelength of 500.7nm and the H-alpha and SII wavelengths of 656.3nm and 671.7nm+673.0nm. For centering on OIII, =8.64ş. For covering both H-alpha and SII, =11.5ş, resulting in =665nm and covering the 625-705nm range.Important is the width w of the source, which determines the resolution of the spectrometer:  The transmission curve of a filter with an infinitely narrow transmission band will show up as having a bandwidth of  . Any transmission curve is broadened ('convolved') by . For a high resolution the width w should be small: For w=0.1mm, f1=500mm and N=100, =1.8nm and with N=300 it improves to =0.6nm. . Any transmission curve is broadened ('convolved') by . For a high resolution the width w should be small: For w=0.1mm, f1=500mm and N=100, =1.8nm and with N=300 it improves to =0.6nm. |
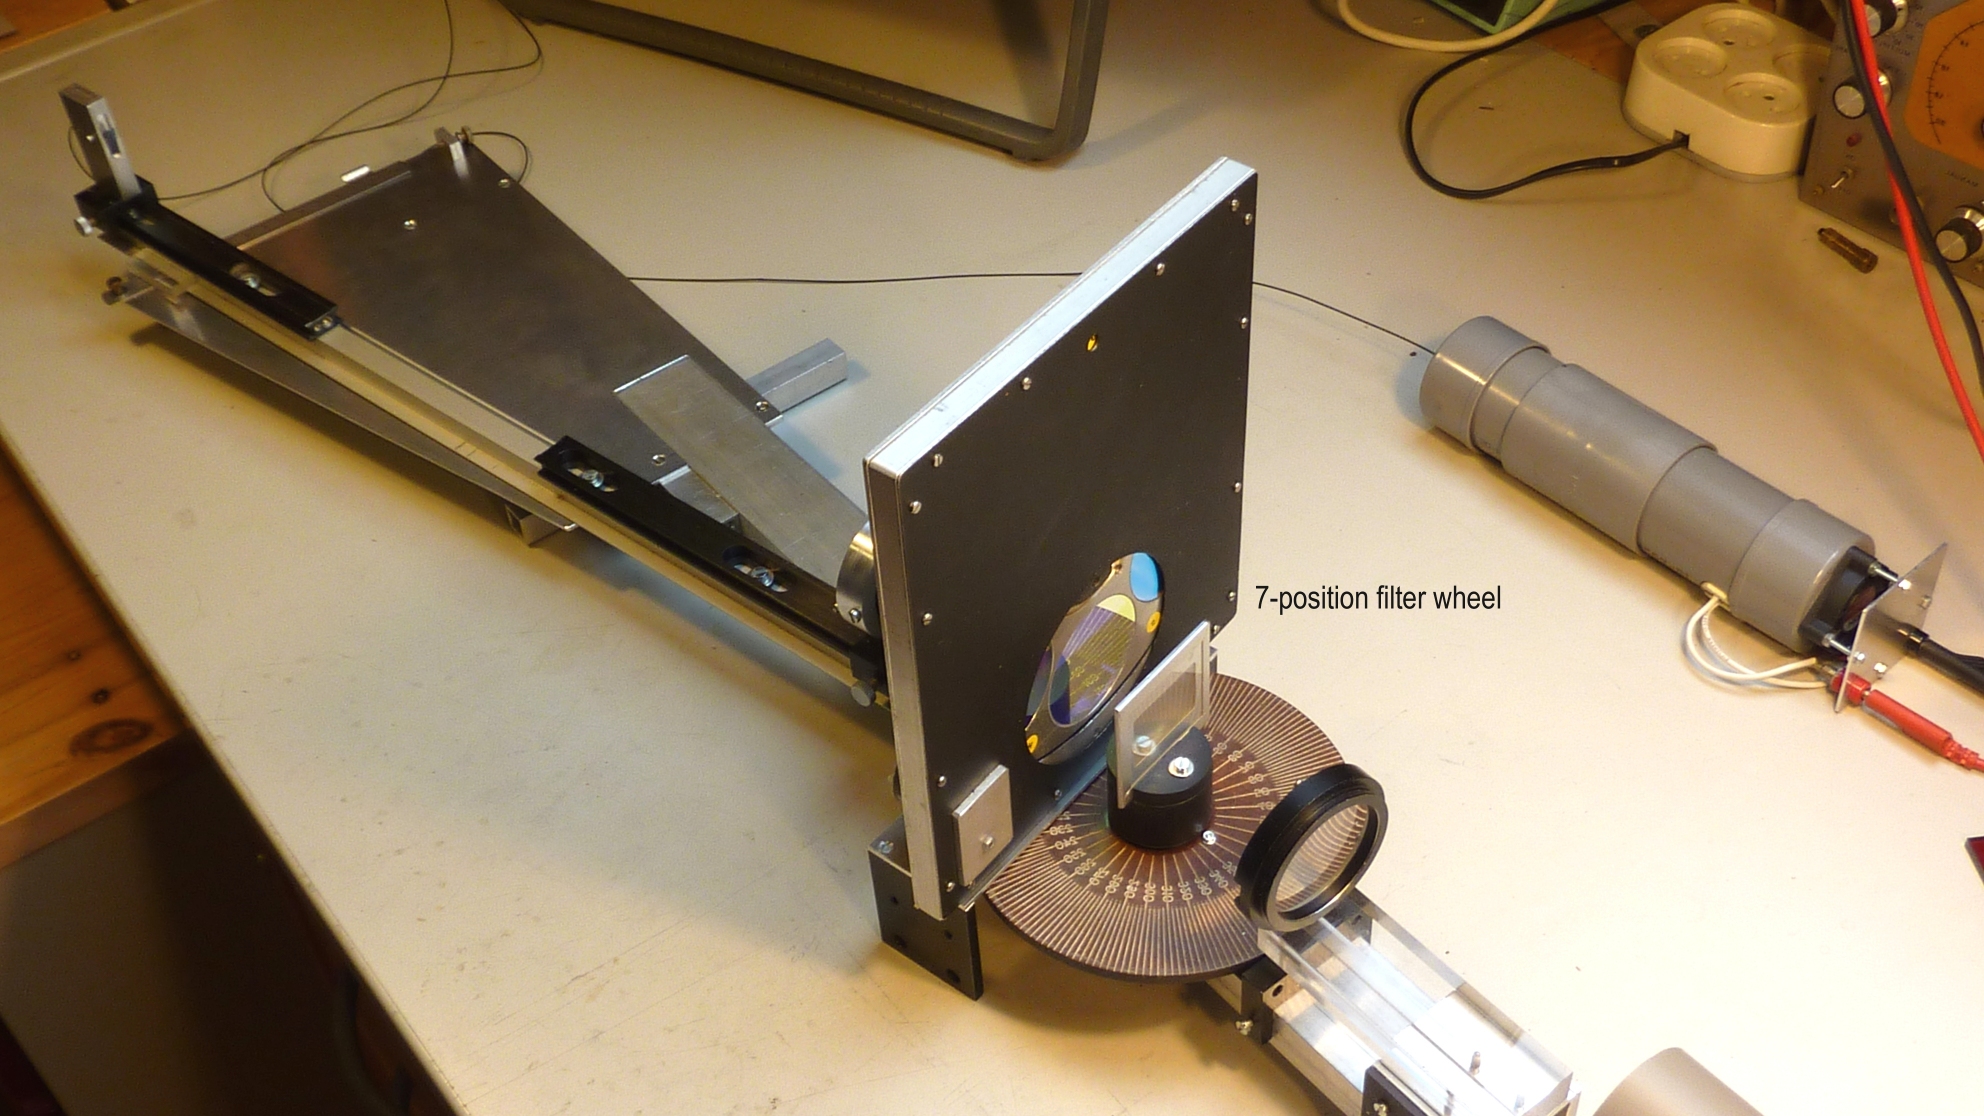
(click to enlarge)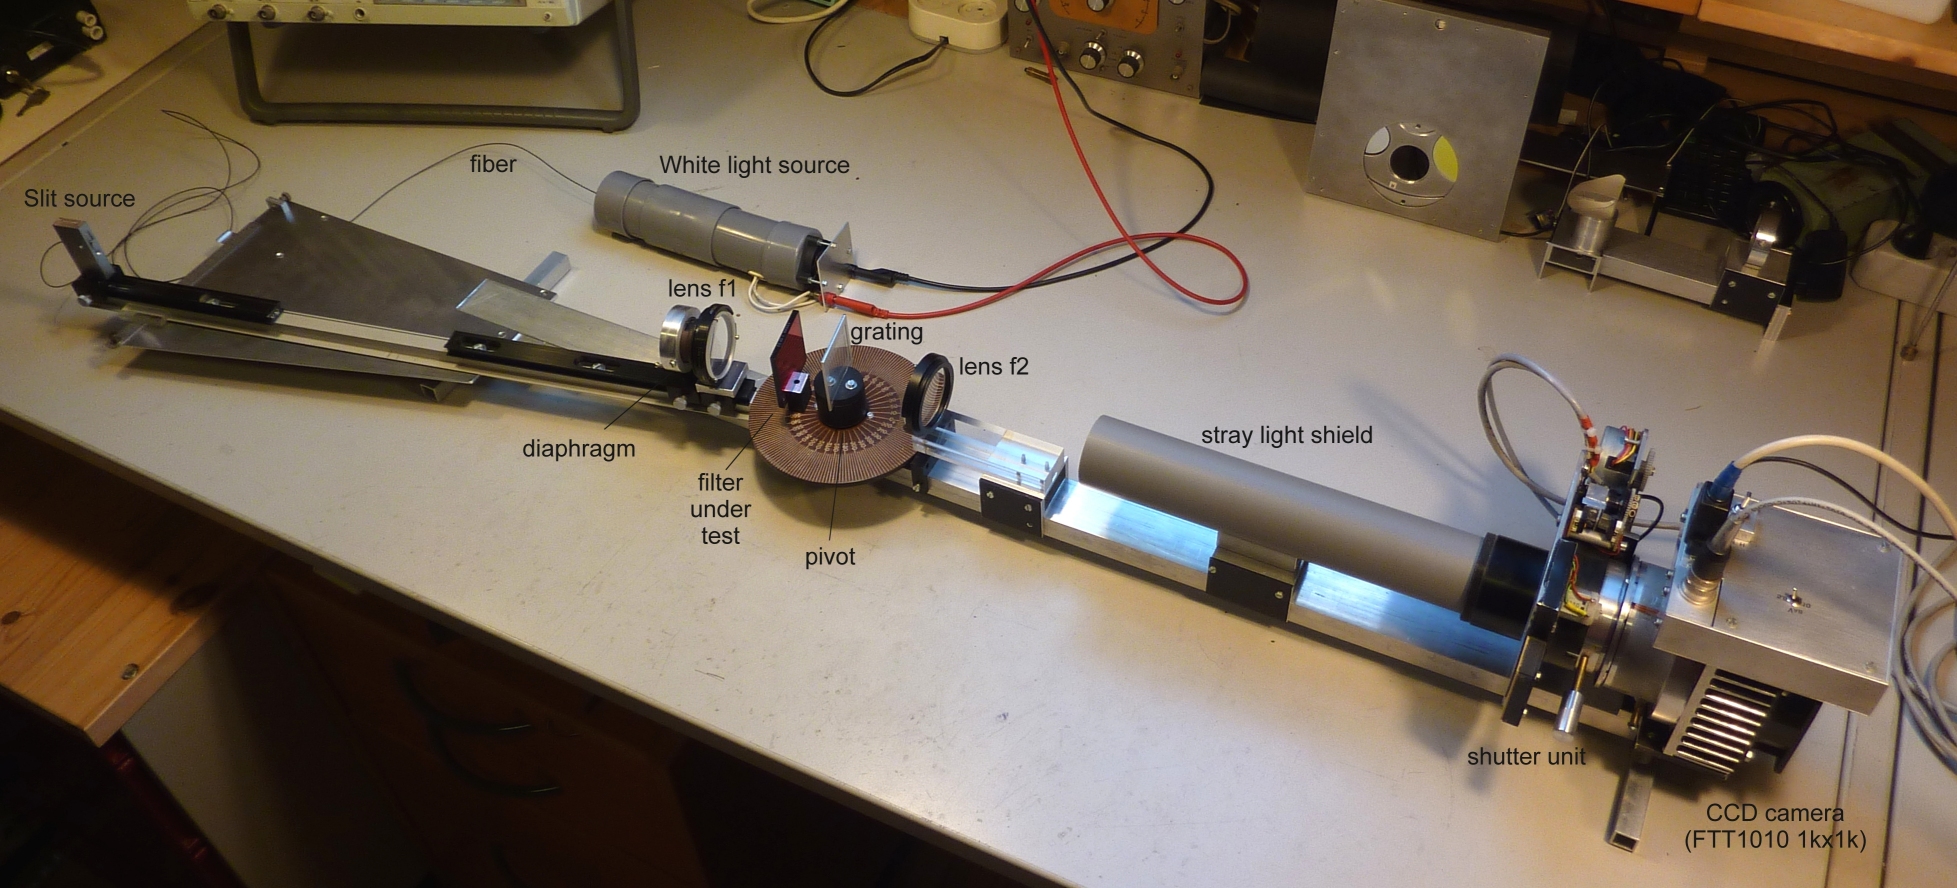 Some more details of the spectrometer setup, a gif showing the simple processing steps and some resulting transmission graphs are shown below. | ||
 |
 |
 |
 |
 |
 |
| More detailed information is contained in this pdf: Spectrometer description.pdf. |